Stricker 2
Report Rundown
Vicinity Map
Layout Map(s)

Location: (42.466°, -114.362°)

Transmission Options
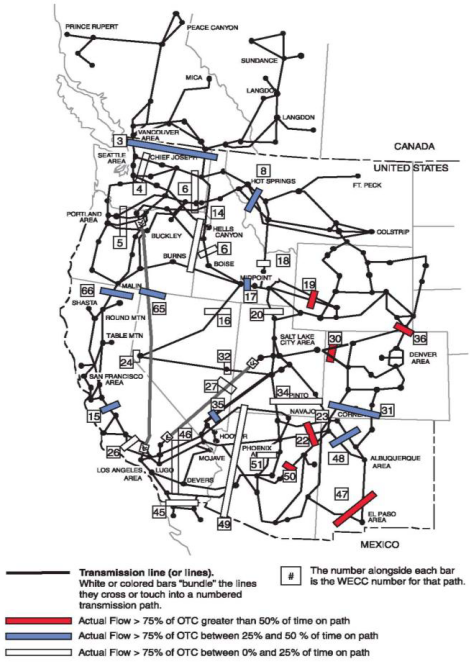
Western US Electrical Power Transmission
The Western Electricity Coordinating Council (WECC) coordinates a number of high voltage power links in western North America. These links, known as WECC Intertie Paths, are not necessarily single transmission line, rather they are interties between various areas. These areas can be quite distant, such as Path 65 between The Dalles, Oregon and Los Angeles, California or short such as Path 62 between Southern California Edison’s Eldorado and LADWP’s McCullough substations. These are currently numbered from 1 to 81, with a few numbers intentionally omitted.
Primary transmission options for this project include the Southwest Intertie Project – North and Boardman to Hemingway.
Source: WECC, Wikipedia

Image Source: National Electric Transmission Congestion Study, DOE 2006
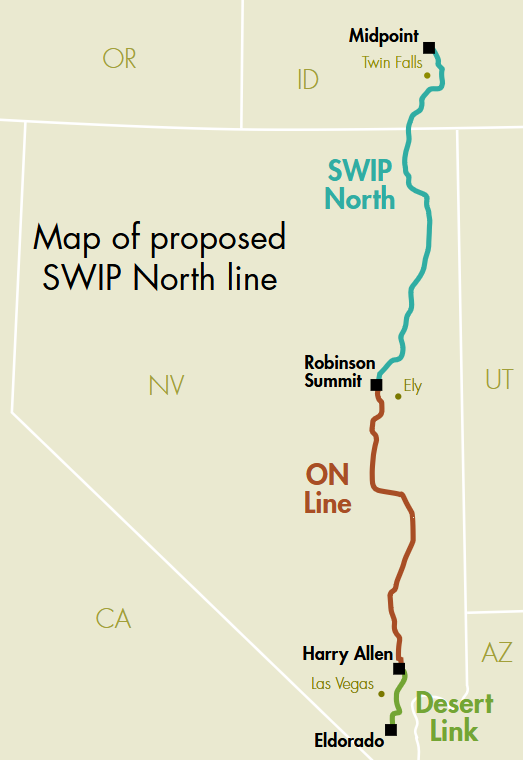
Southwest Intertie Project – North
The SWIP North line would connect the Robinson Summit substation in central Nevada to the Midpoint substation in Idaho, and will extend the 231- mile One Nevada Line (ON Line) that connects to the ISO system at the Harry Allen substation just north of Las Vegas.
There is an existing capacity sharing agreement between LS Power and NV Energy on ON Line and SWIP North that is governed by a Transmission Use and Capacity Exchange Agreement. Upon satisfaction of the ISO Board’s conditions, and upon construction of SWIP North, the arrangement would result in the following capacity entitlements:
- NV Energy would assume 952.5 MW of southbound capacity and 847.5 MW of northbound capacity.
- Idaho Power would assume 500 MW of northbound capacity.
- The remaining Great Basin Transmission entitlements in both directions will be assumed by the ISO (1,117.5 MW in southbound and 572.5 MW northbound).
The SWIP North line is currently estimated to cost about $1 billion. If the ISO and Idaho Power eventually participate, the ISO will be responsible for 77.2% of the overall project costs and Idaho Power for a 22.8% share of the costs associated with its portion of northbound capacity. Project costs will be reviewed regularly and will ultimately be subject to FERC rate approval.
Source: California Independent System Operator (ISO Public)

Image Source: LS Power
Boardman to Hemingway
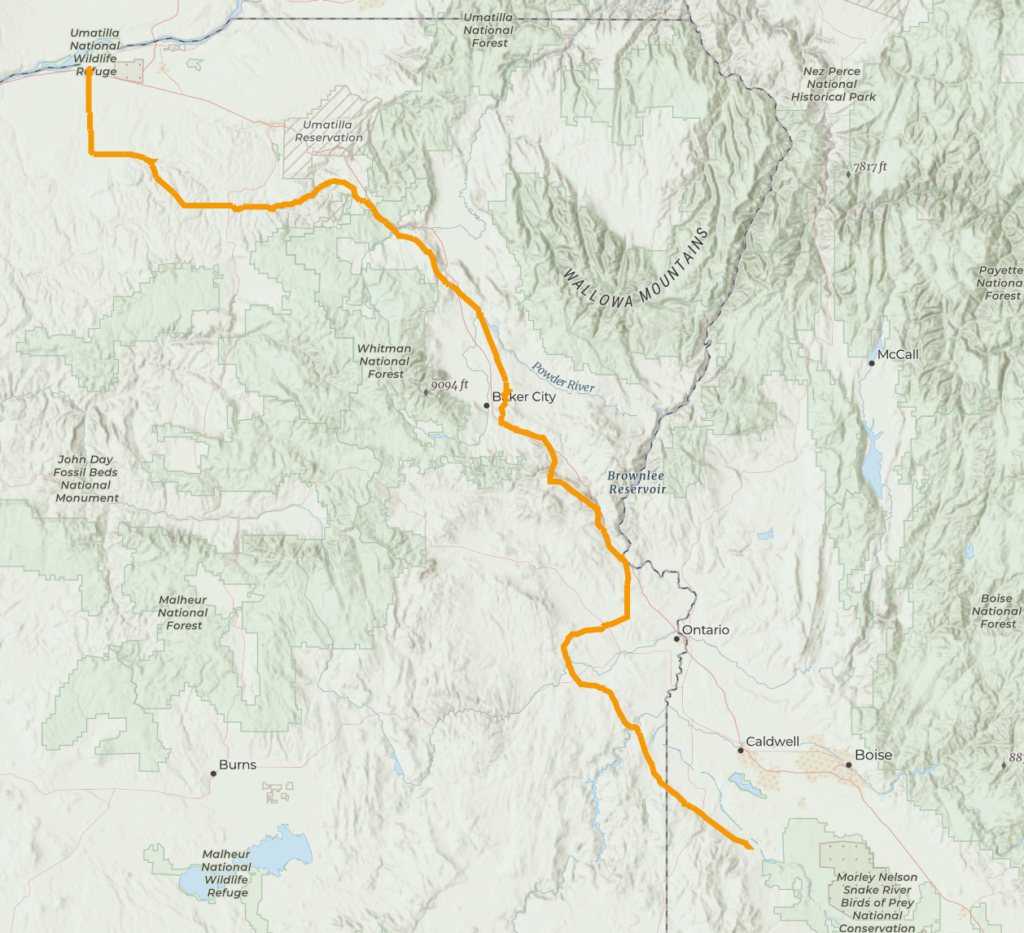
Boardman to Hemingway, or “B2H,” is a proposed 500-kilovolt transmission line that will run approximately 290 miles across eastern Oregon and southwestern Idaho. It will connect the proposed Longhorn Substation four miles east of Boardman, Oregon, to Idaho Power’s existing Hemingway Substation in Owyhee County, Idaho.
Population and business growth in the Pacific Northwest and Intermountain West are driving increased demand for energy. Existing transmission lines between these two regions can’t carry any more energy when it is needed most.
The Boardman to Hemingway line will deliver up to 1,000 megawatts of reliable, affordable, clean power in each direction, helping utilities meet customer demand, especially during the Pacific Northwest’s winter peak and the Mountain West’s summer peak.
B2H is a cleaner, less expensive, lower-risk solution than building new carbon-emitting plants, and it’s less expensive than building new solar or battery storage plants. It will improve reliability, reducing the likelihood and duration of outages, while helping to keep energy prices affordable.
Source: Idaho Power

Image Source: Idaho Power
Project Details
Racking
| Racking Inputs | |
|---|---|
| Racking Product | Terrasmart TerraTrak 2P |
| Type | Single Axis Tracker |
| Grade Limit | 20% |
| Backtrack | Yes |
| Tracking Angle | +/-60° |
| Height Above Ground | 2.1 m |
| Racking Dimensions Mode | Auto |
| Tracker Sizes | Qty | Module Count | Tracker X | Tracker Y |
| A | 126 | 90 | 5.04 m | 52.70 m |
| B | 43 | 60 | 5.04 m | 35.41 m |
| C | 0 | 30 | 5.04 m | 18.11 m |
Module
| Module Inputs | |
|---|---|
| Module Name | Q. Peak Duo XL-G11S |
| Module Rating | 590 W |
| Module Width | 1.134 m |
| Module Height | 2.462 m |
| Module Area | 2.79 m2 |

| IAM | Values |
|---|---|
| 0 | 1 |
| 30 | 1 |
| 50 | 0.999 |
| 60 | 0.996 |
| 70 | 0.978 |
| 75 | 0.944 |
| 80 | 0.856 |
| 85 | 0.622 |
| 90 | 0 |
Inverter
| Inverter Inputs | |
|---|---|
| Inverter Name | SMA Peak 3 125-US |
| Inverter Rating | 125 kW |
| AC Power Nom | 125 kWac |
| Min MPPT | 860 V |
| AC Power Max | 130 kWac |
| Max MPPT | 1450 V |
| Max Efficiency | 98.9 % |
| Max PV Volts | 1500 V |
| DC at Max Power | 131.45 kW |
| Night Power Use | 4 W |

Performance
| Performance Inputs | |
|---|---|
| Modules Per String | 30 |
| DC Degradation | 0.5 % |
| Thermal Constant Loss | 29 W/m2k |
| Thermal Wind Loss | 0 W/m2k/m/s |
| Mod Quality Loss | -1 % |
| Mod LID Loss | 1.50 % |
| DC Module Mismatch | 1.5 % |
| DC Strings Mismatch | 1.5 % |
| DC Wiring Loss @ STC | 2 % |
| Bifacial Back Mismatch | 10 % |
| Auxiliaries | 0 kW |
| AC Wiring Loss @ STC | 2 % |
| Transformer Constant Loss | 0 % |
| Transformer Loss @ STC | 0 % |
| MV Line Loss @ STC | 0 % |
| Transmission Loss | 0 % |
| Other AC Losses | 0 % |
| JAN | FEB | MAR | APR | MAY | JUN | JUL | AUG | SEP | OCT | NOV | DEC | |
| Soiling (%) | 2 | 2 | 2 | 2 | 2 | 2 | 2 | 2 | 2 | 2 | 2 | 2 |
| Albedo | 0.2 | 0.2 | 0.2 | 0.2 | 0.2 | 0.2 | 0.2 | 0.2 | 0.2 | 0.2 | 0.2 | 0.2 |
Layout
| Layout Inputs | |
|---|---|
| GCR | 0.50 |
| Pitch | 10.07 m |
| Azimuth | 180° |
| Racks Removed based on Grade | Off |
| Intrarow Spacing | 5.04 m |
| Buildable Area | 10.32 ha |
| Coordinate System | WGS 84 |
Bill of Materials
| BOM Table | |
|---|---|
| Rack A Qty | 126 |
| Rack B Qty | 43 |
| Rack C Qty | 0 |
| Module Qty | 13920 |
| Inverter Quantity | 58 |
Performance Results
| GHI (kWh/m2) | DHI (kWh/m2) | Temp (C°) | Wind (m/s) | Global Incident (kWh/m2) | EArray (MWh) | E_Grid (MWh) | PR (%) | |
|---|---|---|---|---|---|---|---|---|
| JAN | 51.8 | 24 | -2.52 | 3 | 67.1 | 8.9 | 504.6 | 53.13 |
| FEB | 78.5 | 30.7 | 0.56 | 2.9 | 101.6 | 13.7 | 764.8 | 53.15 |
| MAR | 124.8 | 55.2 | 5.04 | 3.6 | 158.7 | 21.5 | 1171.4 | 52.13 |
| APR | 168 | 61.1 | 6.69 | 3 | 214.9 | 29.3 | 1555.2 | 51.10 |
| MAY | 210.4 | 69.4 | 13.58 | 2.7 | 266.5 | 36.5 | 1869.2 | 49.53 |
| JUN | 231.8 | 64.1 | 17.91 | 2.9 | 297.3 | 40.7 | 2048.8 | 48.67 |
| JUL | 242.5 | 55.5 | 26.71 | 2.5 | 315.7 | 43.3 | 2107.5 | 47.15 |
| AUG | 208.1 | 43.5 | 23.65 | 2.2 | 274.5 | 37.6 | 1858.7 | 47.83 |
| SEP | 160.8 | 39.4 | 18.96 | 2.2 | 211.8 | 29 | 1474.7 | 49.17 |
| OCT | 112.3 | 34.3 | 9.35 | 2.4 | 148.8 | 20.1 | 1080.5 | 51.29 |
| NOV | 63.5 | 23.8 | 3 | 2.9 | 83.3 | 11.1 | 618.4 | 52.43 |
| DEC | 44.4 | 20.5 | -1.5 | 2.6 | 58.3 | 7.6 | 429.5 | 52.01 |


Loss Tables
| Horizontal global irradiation | 1697 |
| Global incident in coll. plane % | 29.55 % |
| Global incident below threshold | -0.01 % |
| Near Shadings: irradiance_loss | -2.79 % |
| IAM factor on global | -1.78 % |
| Soiling loss factor | -2 % |
| Ground reflection on front side | 0.26 % |
| Effective irradiation on collectors: | 2062.07 kWh/m2 * 38863.36 m2 coll. |
| Global incidence on ground: | 630.38 kWh/m2 on 77,726.72 m2 |
|---|---|
| Ground reflection loss (Albedo) | -80.00 % |
| View Factor for rear side | -74.75 % |
| Sky diffuse on the rear side | 59.28 % |
| Beam effective on the rear side | 0.00 % |
| Shadings loss on rear side | 10.00 % |
| 3.57% Global irradiance on rear side | (73.7 kWh/m2) |
| Array nominal energy at STC (MWh) | 17359.05 |
| Loss due to irradiance level | -0.78 % |
| PV loss due to temperature | -4.29 % |
| Shadings: Electrical loss | 0 % |
| Spectral correction | 0 % |
| Module quality loss | 1 % |
| LID – Light Induce Degradation | -1.5 % |
| Mismatch loss, modules and strings | -1.6 % |
| Mismatch for back irradiance | -0.35 % |
| Ohmic wiring loss | -1.44 % |
| Array virual energy at MPP (MWh) | 15851.09 |
| Inverter Loss during operation (efficiency) | -0.8 % |
| Inverter Loss over nominal inv. power | -0.08 % |
| Inverter Loss due to max input current | 0 % |
| Inverter Loss over nominal inv. voltage | 0 % |
| Inverter loss due to power threshold | 0 % |
| Inverter loss due to voltage threshold | 0 % |
| Night consumption | -0.01 % |
| Available Energy at Inverter Output (MWh) | 15711.57 |
| Auxiliaries (fans, other) | 0 % |
| AC ohmic loss | -1.45 % |
| MV transformer loss | 0 % |
| MV line ohmic loss | 0 % |
| HV transformer loss | 0 % |
| Fixed Transmission Loss | 0 % |
| AC Other | 0 % |
| Unused energy (grid limitation) | 0 % |
| Energy injected into Grid (MWh) | 15483.38 |
| Yield (kWh/kWp) | 1885.27 |